Safety Fleet Performance
Last updated 26 days ago
The Driver Performance and Vehicle Performance tabs give you the full ranking behind the Overview — every scored driver, and every scored vehicle, for the selected 4-week period.
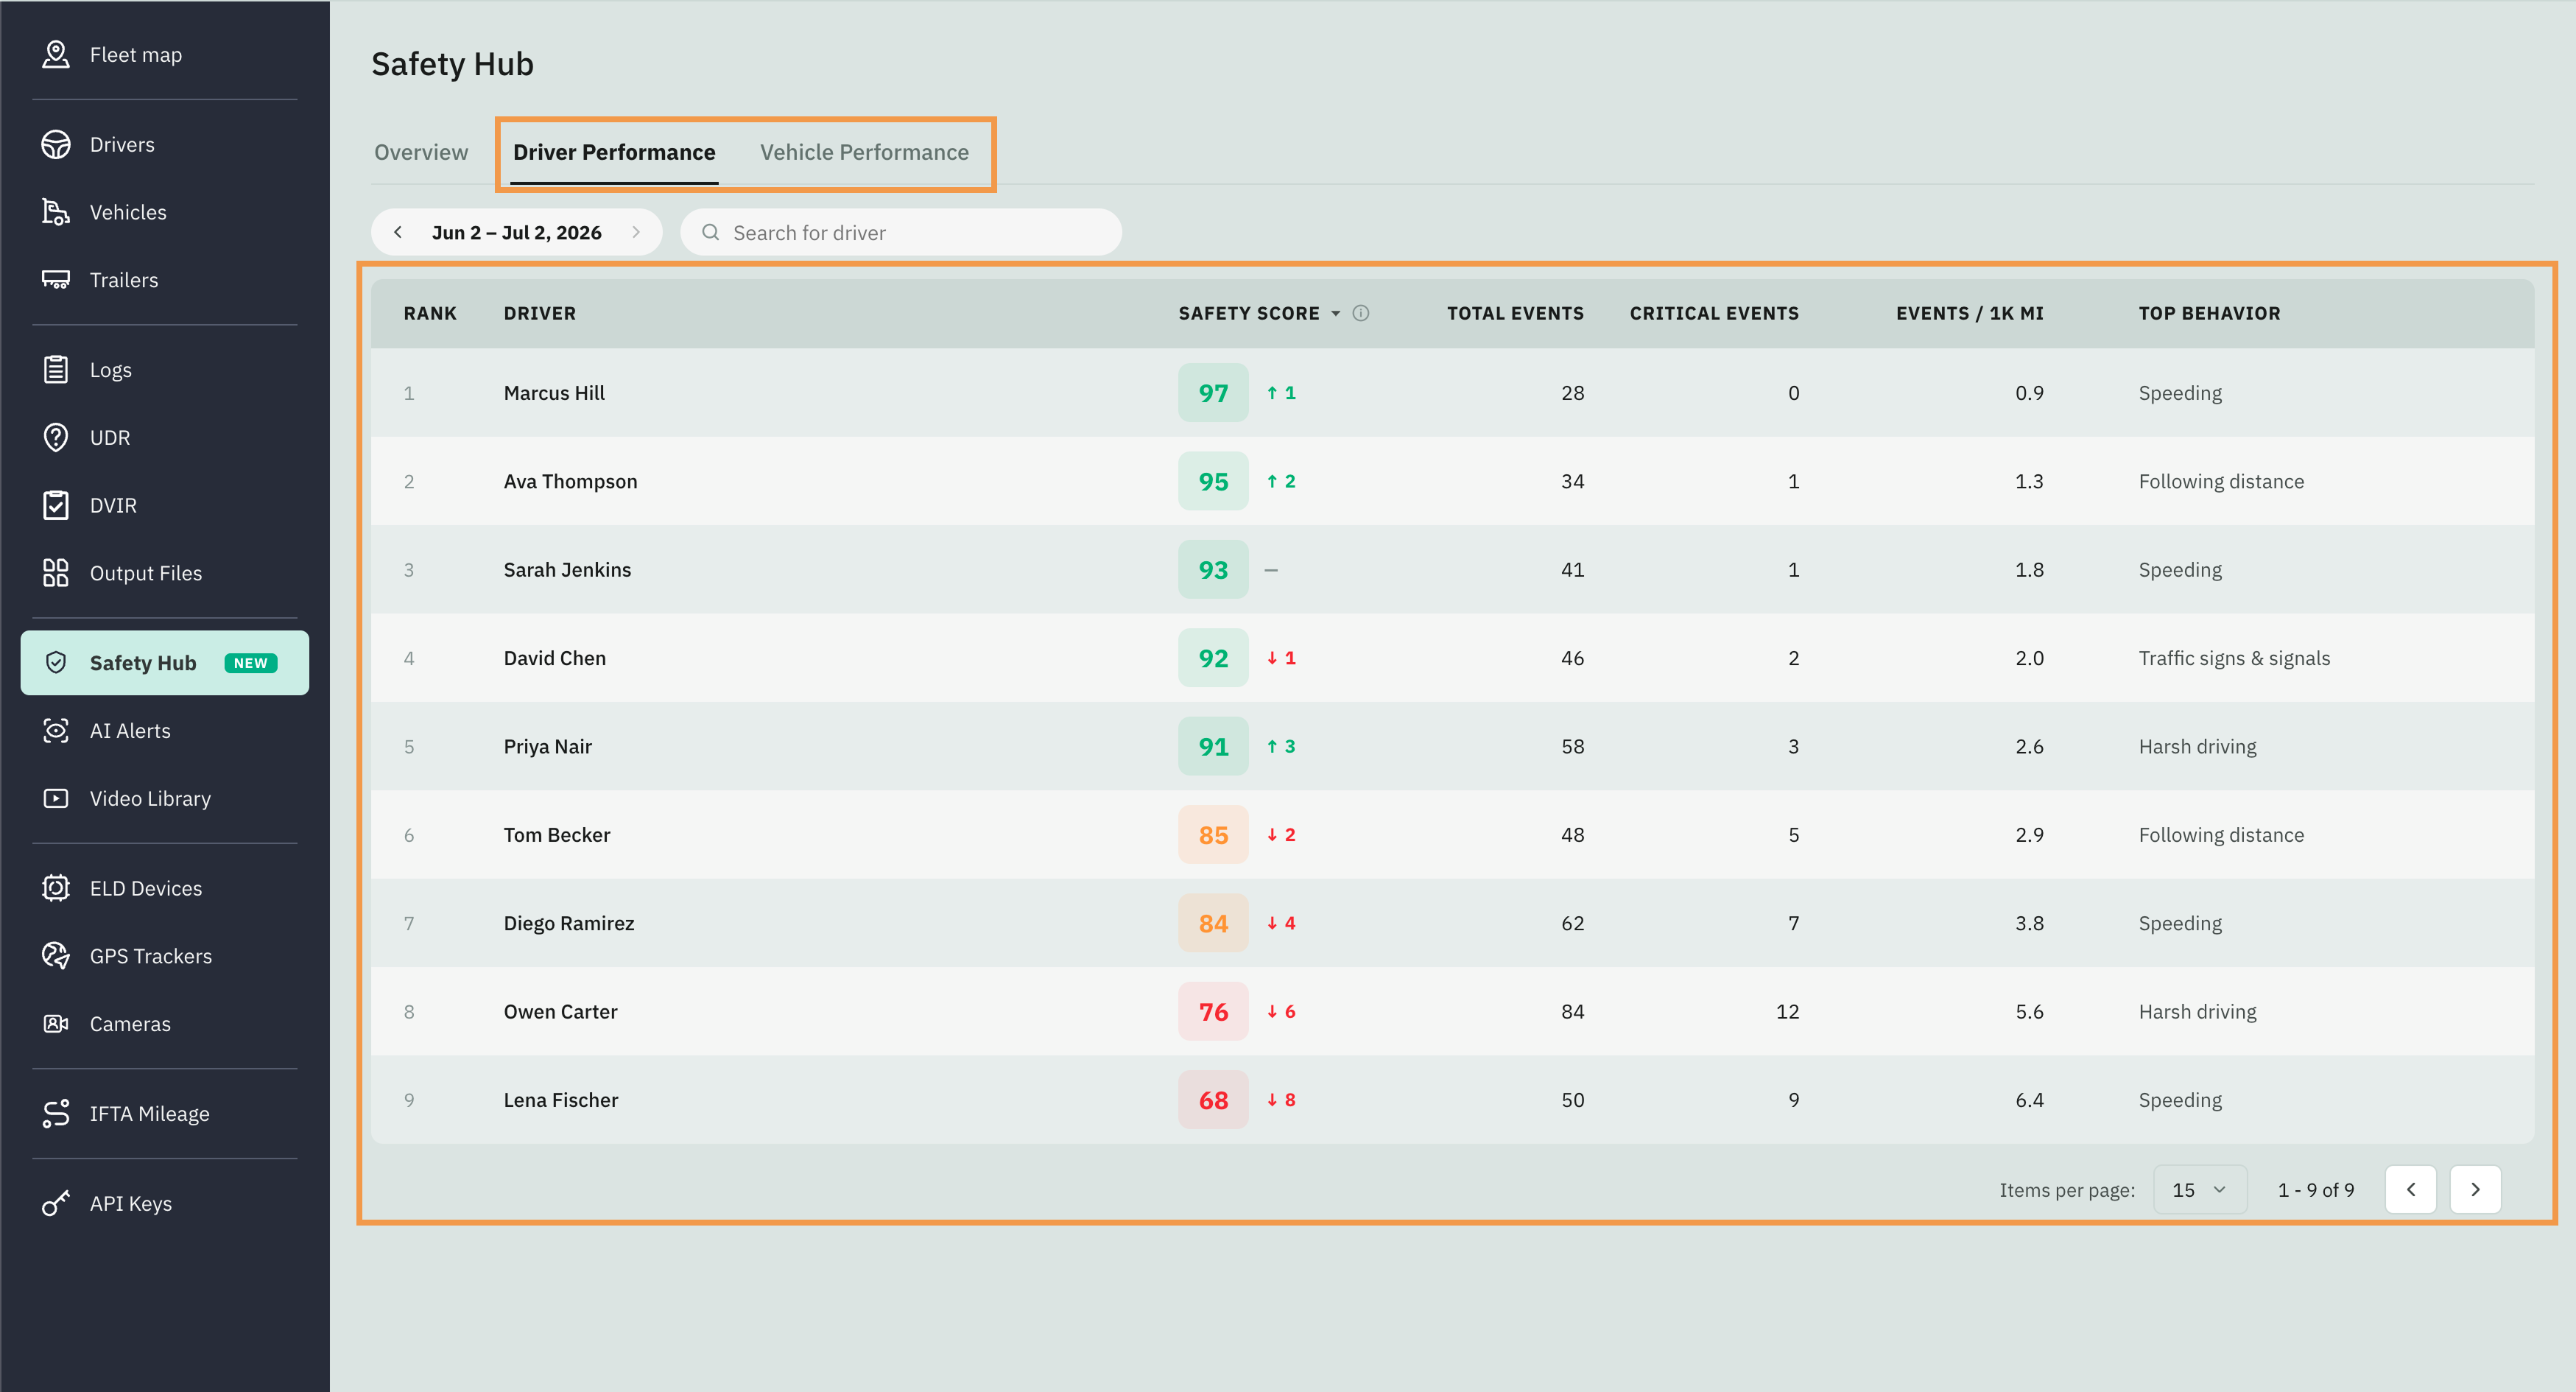
The columns
Reading the Safety Score and trend
The score is a 0–100 grade based on events from the camera(s) assigned to that driver or vehicle, plus any AI Alerts you've manually linked to them.
The trend beside the score is the point change versus the previous 4-week period. The ⓘ icon next to the Safety Score header names the exact previous window the trend is measured against, so you know what you're comparing to.
If your scores aren't ready yet
A driver or vehicle only appears here once a camera assigned to them has collected its first 100 driven miles. Until then, the tab shows a "No driver scores yet" / "No vehicle scores yet" message. Scores refresh every Monday and reflect the last 4 weeks of driving.
Next:
To set your own score bands and behaviour weights, see Score Configurator.