Maintenance Overview
Last updated 23 days ago
The Overview is the first thing you see when you open Maintenance. It pulls together everything the rest of the module already tracks — schedules, repairs, defects, and fault codes — into one read-only picture that answers two questions: what maintenance is costing your fleet, and what needs looking at today.
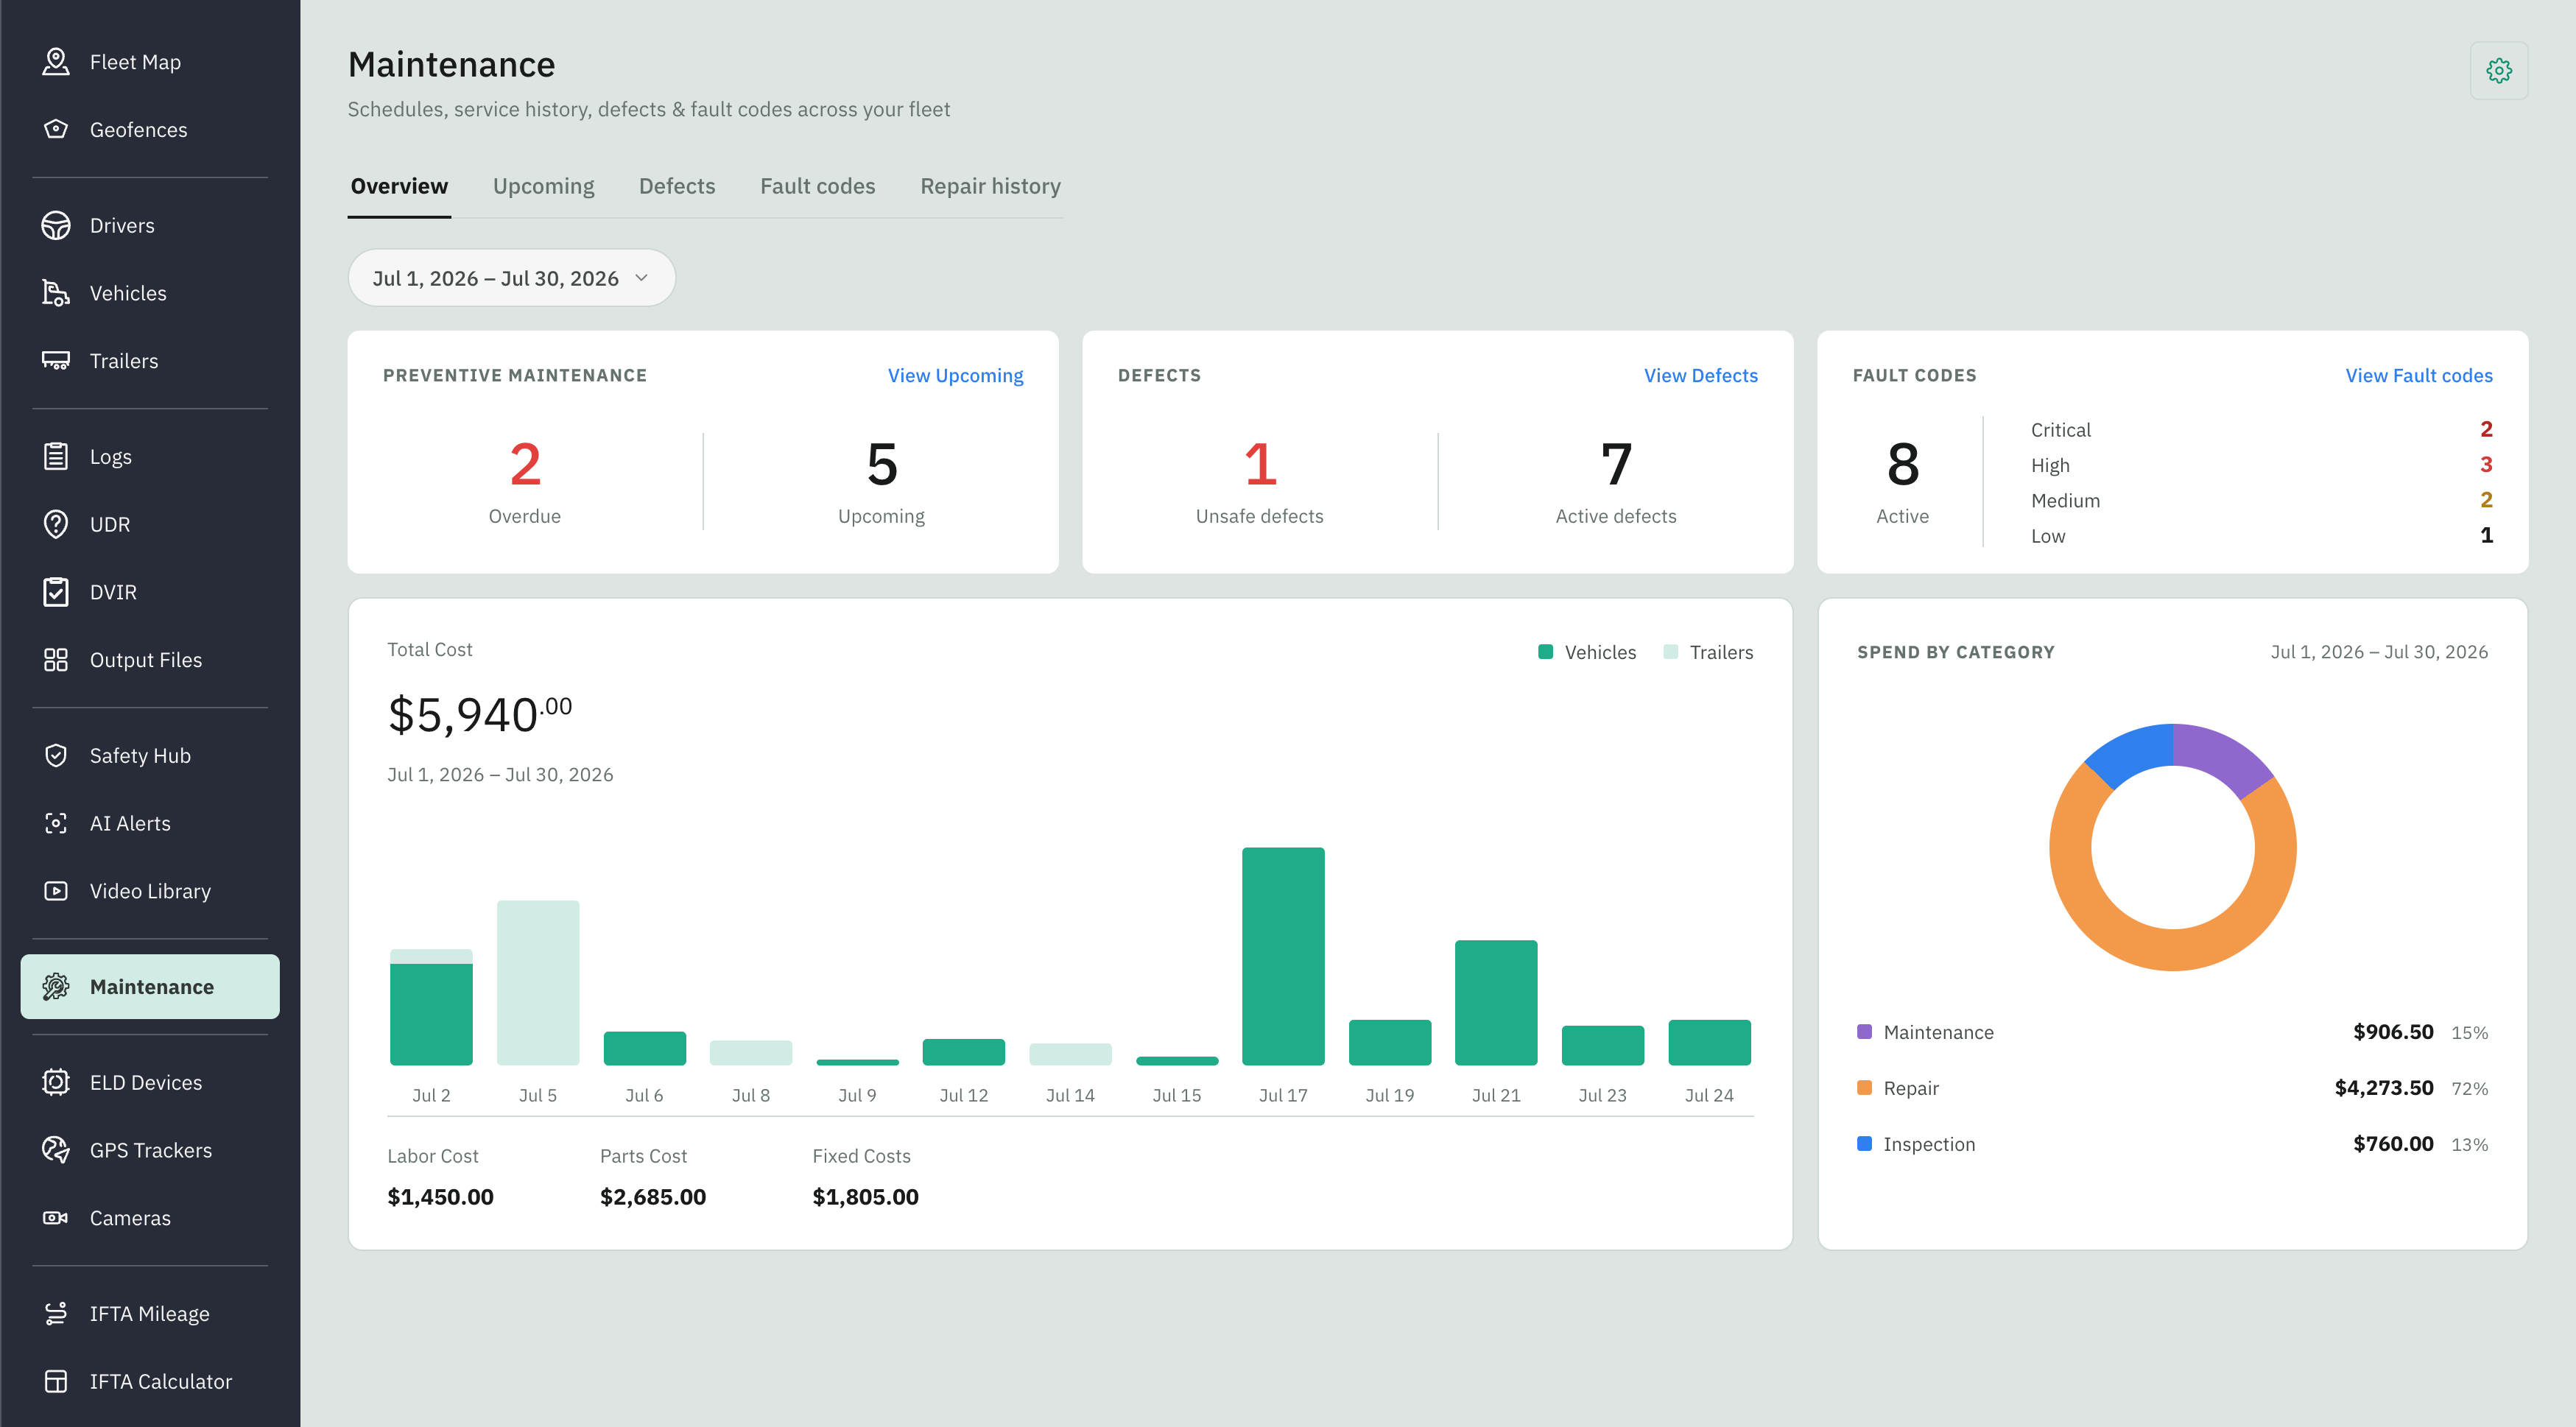
What Needs Attention
Three cards across the top show live counts, always current and never scoped by the date range:
Preventive maintenance — two figures: Overdue (schedules past their due point, in red) and Upcoming (everything needing service, overdue included). View Upcoming jumps to the Upcoming list.
Defects — Unsafe defects (active defects that might put a truck out of service, in red) and Active defects (all unresolved, unsafe included). View Defects opens the Defects view.
Fault codes — the total Active faults across the fleet, with a breakdown beside it counting them by severity: Critical, High, Medium, and Low, each in its own color. View Fault codes opens the Fault codes view.
What it’s costing
Two charts below the state cards show spend, and these do follow the date range:
Spend over time — your total cost for the range, broken into bars by day. Each bar splits by asset class — vehicles and trailers — and hovering shows that period's total. Beneath the headline, the total breaks into labor, parts, and fixed cost.
Spend by category — a donut splitting the same total three ways: Maintenance, Repair, and Inspection. Each slice lists its amount and share.